
SINAI 2026 Mid-Year Updates: Owning your data with confidence
Ready to shift from compliance to competitive advantage?
Book a demo and see how SINAI can help you streamline data, meet requirements, and build stakeholder trust.

Every sustainability team has been through some version of this: a number in the report looks off, no one is quite sure where it came from, and the entire team is scrambling three days before a disclosure deadline. Confidence in the data is not a soft benefit. It is what makes the reporting cycle possible.
In the first half of 2026, SINAI focused on that confidence. Every launch this quarter helps sustainability teams take more ownership of their emissions data, from the moment it enters the platform to the moment it appears in a disclosure. Here's what we shipped and what it means for your team.
SINAI Measure
Anomaly Detection: The Control Layer Your Inventory Is Missing
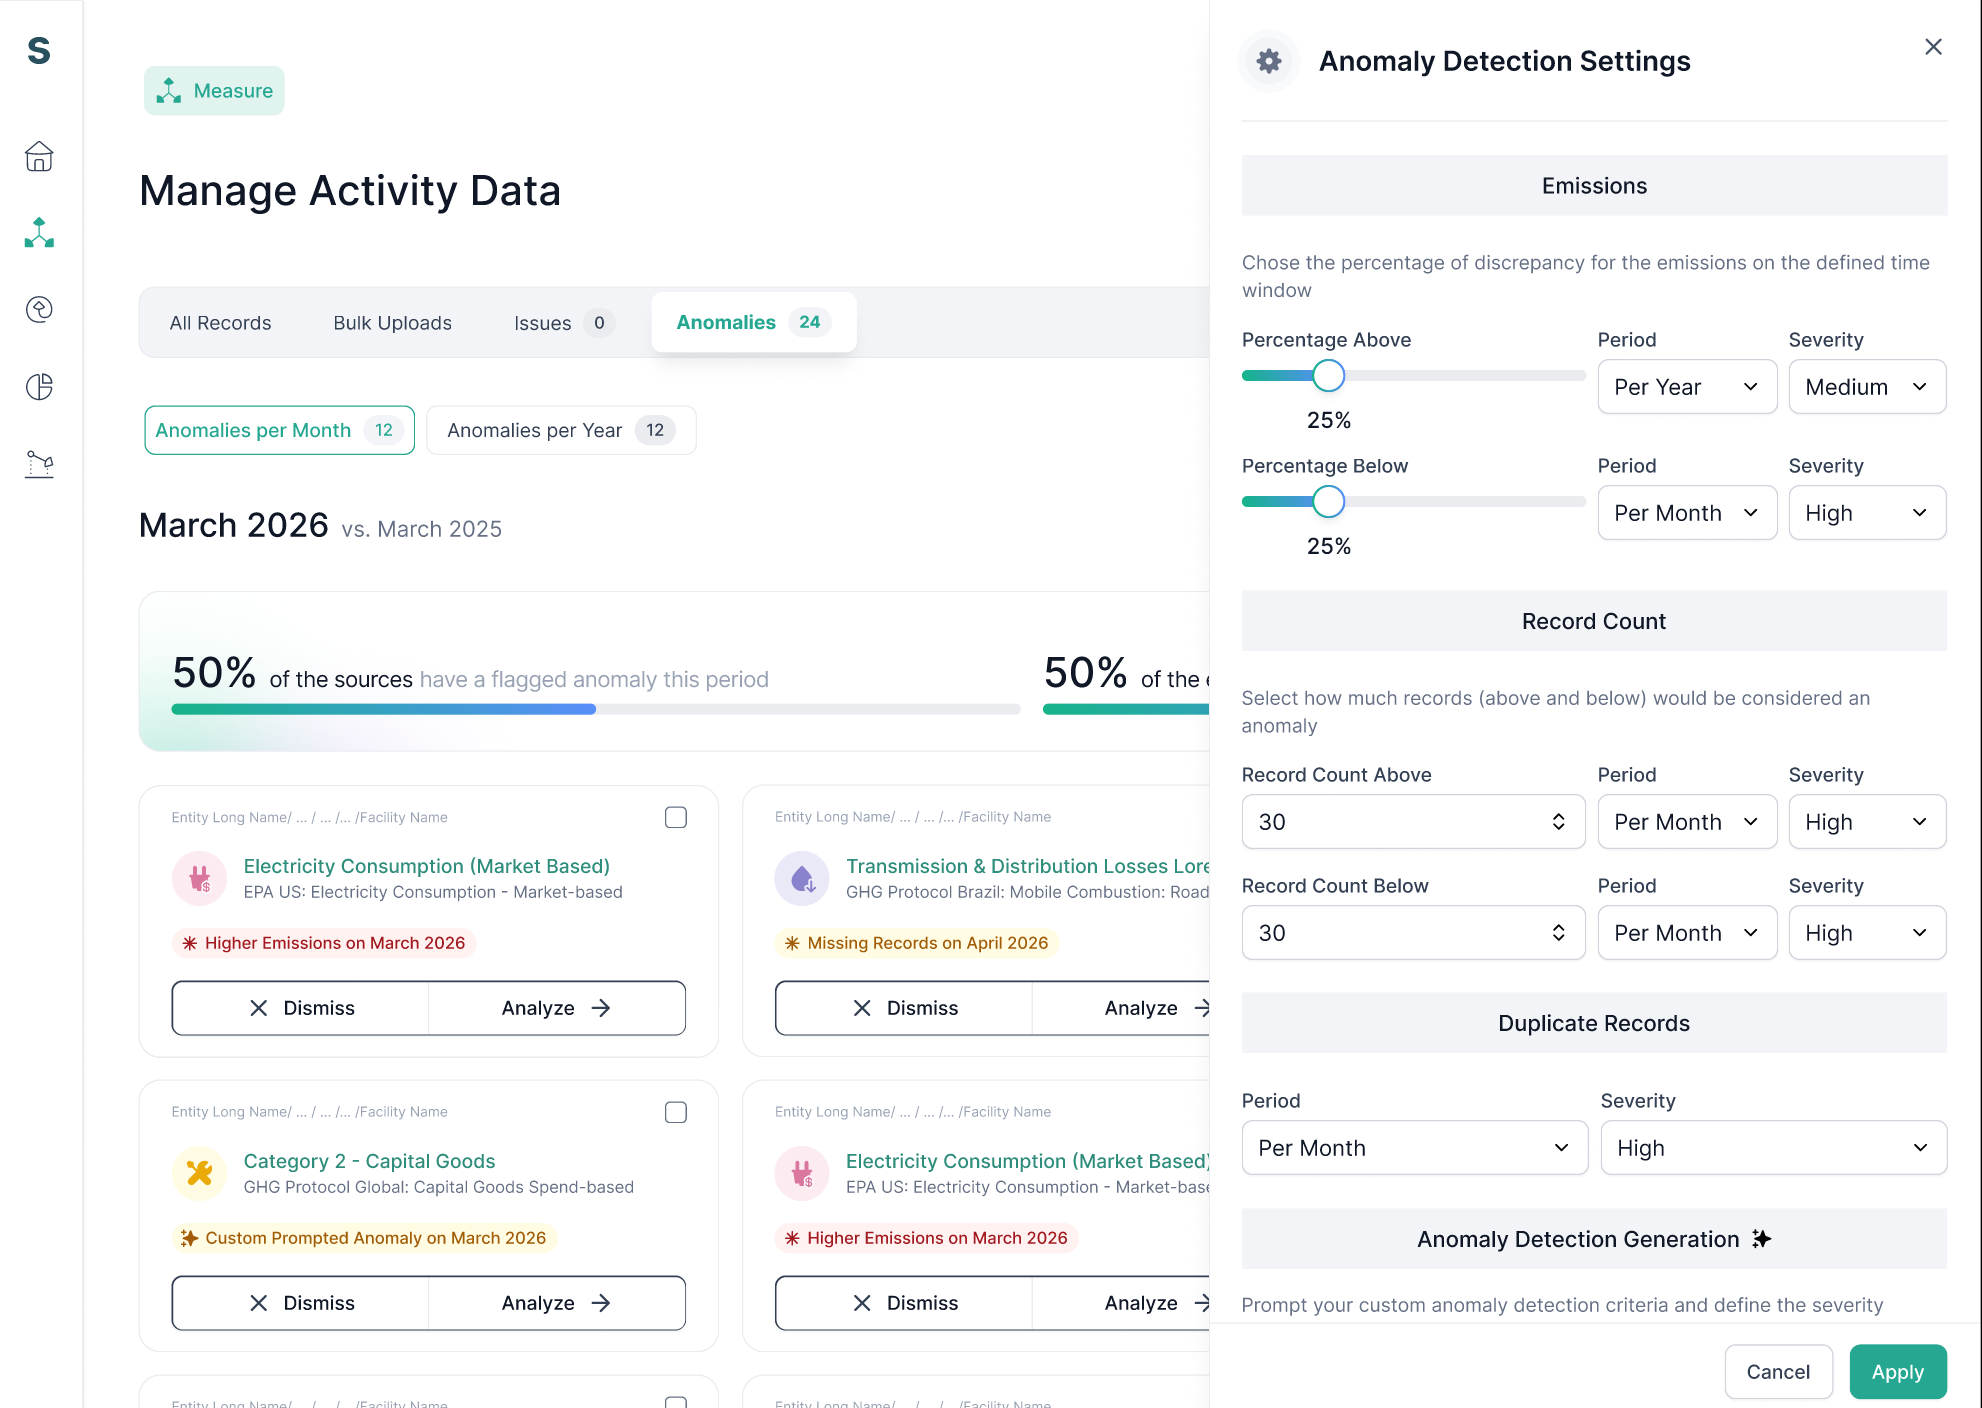
Somewhere in your last inventory cycle, there was a record that didn't belong. The question is: Did your team find it, or did the auditor? Anomaly Detection flags those records before they reach disclosure. It runs inside Manage Activity Data, as part of the workflow your team already uses.
- Define your own thresholds. Set the parameters that reflect how each facility runs.
- Let SINAI suggest anomaly rules based on your data. Not sure where to start? Periodic discovery surfaces potential rules you can review and enable.
- Resolve in context. When a flag appears, review, resolve, or dismiss it directly from the anomaly view, without navigating away.
- Create custom anomaly types with AI. Use AI to help create custom anomaly rules from business logic, then preview, review, and enable them.
Take a tour of SINAI's anomaly Detection feature
SINAI Report
Advanced Analytics: From Data to Disclosure, All Inside the Platform
Assembling information for stakeholders, regulators, auditors, and internal reviews typically means pulling data from the carbon accounting platform and rebuilding it elsewhere. Improved dashboards, custom analytics, and reporting views now live directly inside SINAI's platform, organized by theme so teams can move from data to disclosure without leaving the workflow.
- Explore data by theme. Filter across emissions, consumption, intensity, water, and waste in one place.
- Access framework-specific reports. Specialized views are expanding, including live dashboards for California SB 253 and GHG Protocol Brazil, with more frameworks queued for the coming quarters.
- Request custom dashboards. Additional dashboards can be requested through the SINAI Report, with a defined intake and delivery process by the SINAI team.
- Export what you need. Download data and visualizations for sharing, review, or archival.
SINAI Reduce
Projects by Facility: Manage Reduction Project Financials at Enterprise Scale
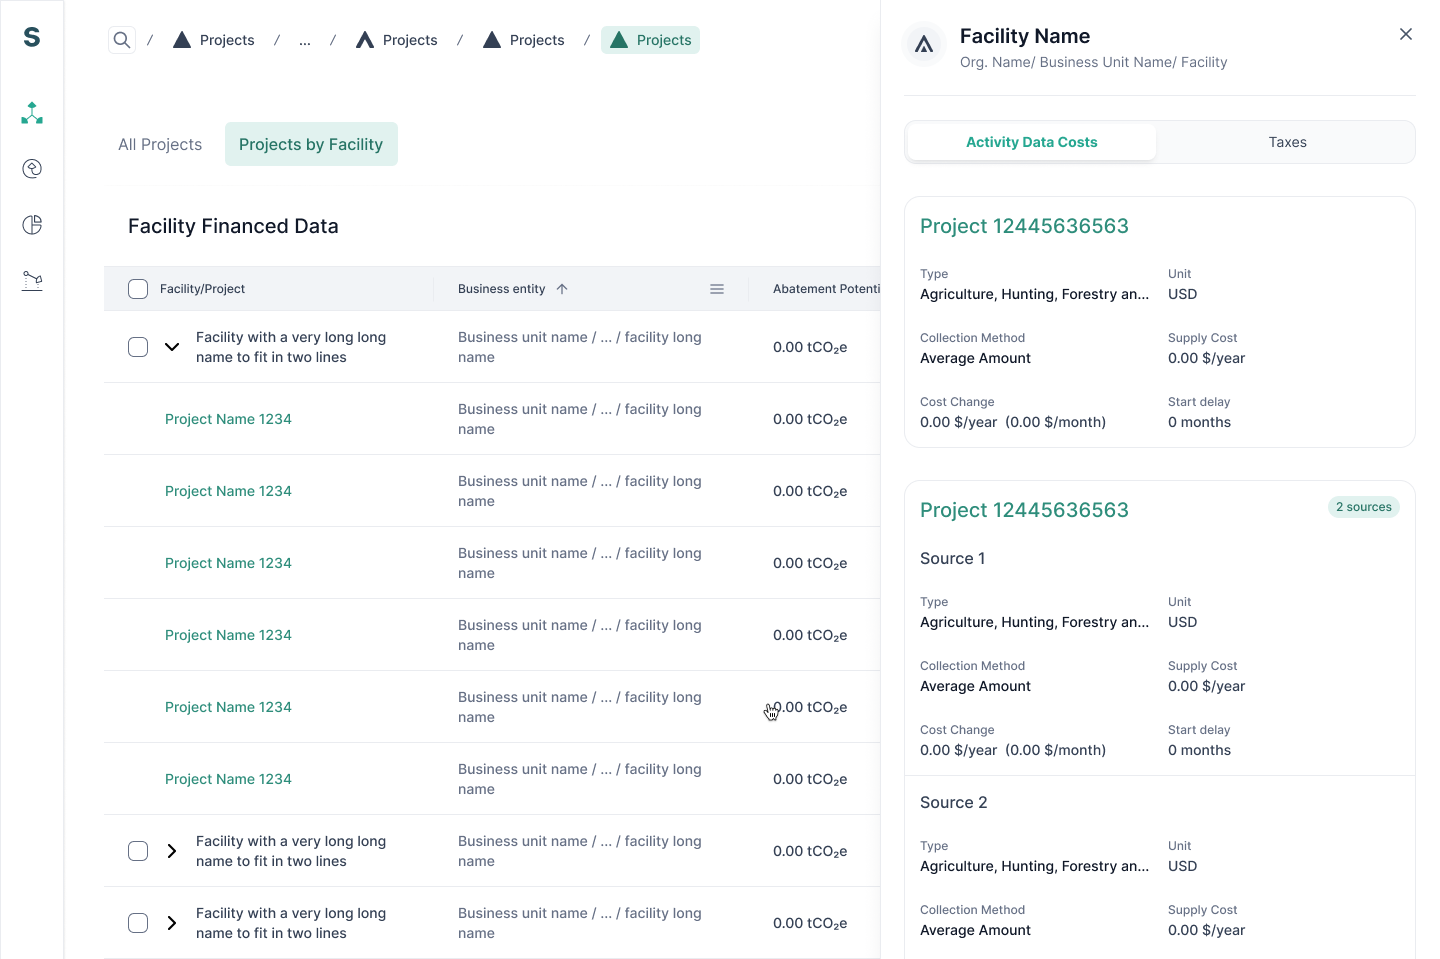
Enterprise teams manage dozens or hundreds of reduction projects, and updating activity data, costs, taxes, and project financials across all of them has long been one of the most manual parts of the Reduce workflow. Projects by Facility groups projects by the facility they belong to and brings bulk edit directly into the same tab.
- See projects grouped by facility. Financials, activity data, costs, and taxes are visible at the facility level in one view.
- Bulk edit across multiple facilities. Apply the same values across all selected facilities at once, or edit facility by facility when the numbers vary.
- Stay inside the workflow—no navigation between individual project screens to align the values.
What else is new
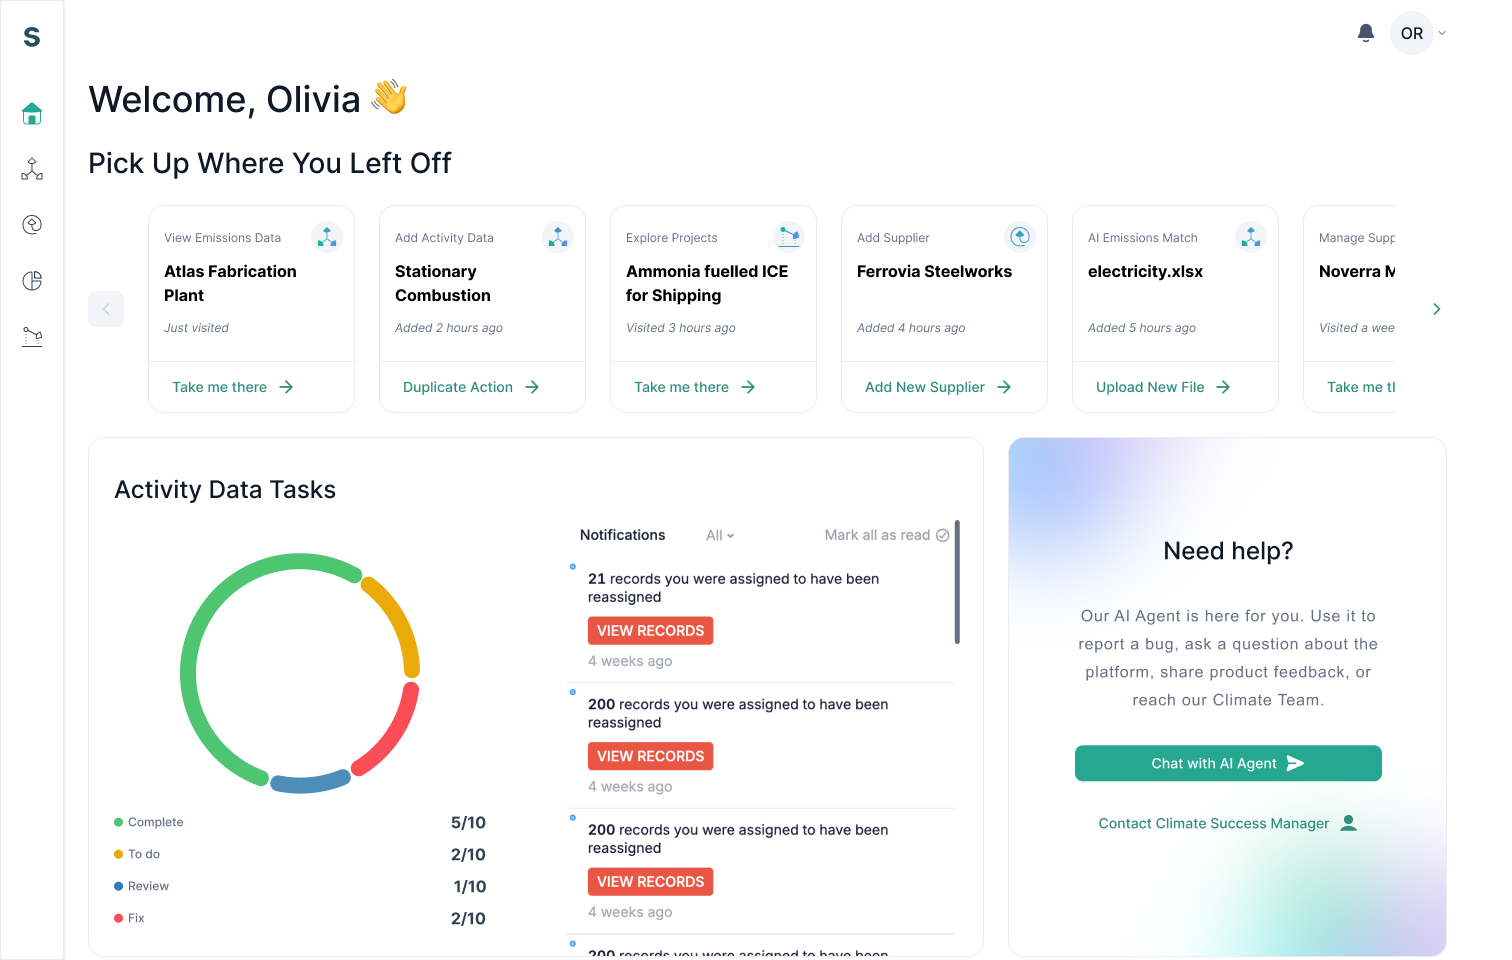
A fresh starting point. The SINAI Welcome page makes it easier to return to important work, monitor outstanding tasks, get help, and navigate to frequently used areas. Use the Pick up where you left off section to quickly jump back into a recently viewed record, duplicate it, and create a new entry without starting from scratch.
Coming soon
Improved Dual Reporting for Electricity
Support for Scope 2 dual reporting is expanding across AI Emissions Match and Utility Bill Automation. New enhancements will better support location- and market-based emissions, renewable electricity, supplier-specific emission factors, and residual mix. Hence, the dual-reporting data you upload or automate is more accurate and consistent across SINAI.
Q2 was a quarter about closing the gap between the data teams collect and the confidence they need in it. And bigger updates are on the way.
Our team is actively building new AI-powered features to help sustainability leaders make stronger strategic decisions. We can't wait to share what's coming, and we'll bring more details soon.
Want to see any of these features in action? Request a demo.
Check what else we shipped this year and in 2025:
Q1 updates - for better data and faster decisions
Utility Automation - for audit-ready emissions data
Accurate emissions inventory with AI Emissions Match
2025 at SINAI: A year of automation+ assurance ready carbon accounting



-2.png)
.jpg)



'%3e%3cg id='Final-Copy-2_2_' transform='translate(1275.000000, 200.000000)'%3e%3cpath class='st0' d='M7.4,12.8h6.8l3.1-11.6H7.4C4.2,1.2,1.6,3.8,1.6,7S4.2,12.8,7.4,12.8z'/%3e%3c/g%3e%3c/g%3e%3c/g%3e%3cg id='final---dec.11-2020'%3e%3cg id='_x30_208-our-toggle' transform='translate(-1275.000000, -200.000000)'%3e%3cg id='Final-Copy-2' transform='translate(1275.000000, 200.000000)'%3e%3cpath class='st1' d='M22.6,0H7.4c-3.9,0-7,3.1-7,7s3.1,7,7,7h15.2c3.9,0,7-3.1,7-7S26.4,0,22.6,0z M1.6,7c0-3.2,2.6-5.8,5.8-5.8 h9.9l-3.1,11.6H7.4C4.2,12.8,1.6,10.2,1.6,7z'/%3e%3cpath id='x' class='st2' d='M24.6,4c0.2,0.2,0.2,0.6,0,0.8l0,0L22.5,7l2.2,2.2c0.2,0.2,0.2,0.6,0,0.8c-0.2,0.2-0.6,0.2-0.8,0 l0,0l-2.2-2.2L19.5,10c-0.2,0.2-0.6,0.2-0.8,0c-0.2-0.2-0.2-0.6,0-0.8l0,0L20.8,7l-2.2-2.2c-0.2-0.2-0.2-0.6,0-0.8 c0.2-0.2,0.6-0.2,0.8,0l0,0l2.2,2.2L23.8,4C24,3.8,24.4,3.8,24.6,4z'/%3e%3cpath id='y' class='st3' d='M12.7,4.1c0.2,0.2,0.3,0.6,0.1,0.8l0,0L8.6,9.8C8.5,9.9,8.4,10,8.3,10c-0.2,0.1-0.5,0.1-0.7-0.1l0,0 L5.4,7.7c-0.2-0.2-0.2-0.6,0-0.8c0.2-0.2,0.6-0.2,0.8,0l0,0L8,8.6l3.8-4.5C12,3.9,12.4,3.9,12.7,4.1z'/%3e%3c/g%3e%3c/g%3e%3c/g%3e%3c/g%3e%3c/svg%3e)